An Update to Clickme: Interactive Visualizations in R
13 September 2013
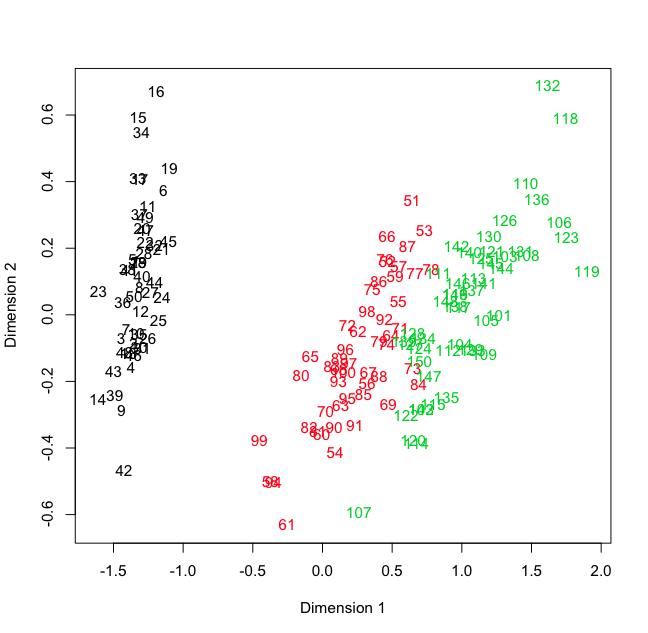
I just released an update that makes it easy to hide all the color groups in a scatterplot except one. Simply click on “Show one”. This is very useful to carry out exploratory analyses when there are many color groups. You can zoom around the plot by scrolling up and down with the mouse wheel.
I think these types of plots are much more usable than the static ones that R generates by default:
You can read more about Clickme at rclickme.com. To install (or update to) the latest version, run the following in R:
install.packages("devtools")

library(devtools)
install_github("clickme", "nachocab")

library(clickme)
clickme(points, 1:10)